[Back to TullyRunners Home Page]
|
TullyRunners.com - Article |
Speed Ratings and Track Times -
A Statistical Correlation
Bill Meylan
(April 16, 2007)
Link - Chart of Speed
Ratings with Corresponding Times for 1600 Meters & 3200 Meters and 1500 Meters &
3000 Meters
Introduction
Every year I receive inquires concerning the relationship
of speed ratings and track times ... Basically, people want to know how to
translate a certain track time (such as 3200m or 1600m track time) into a cross
country speed rating. To be honest, the relationship is not that great and
is best described by a fairly wide range of values (which may or may not be
useful). With the number of inquiries increasing, I decided to post a
formal presentation that describes the relationship in terms of statistics with
a resulting chart of corresponding times and speed ratings ...
The chart is posted on a separate web-page
... This article describes how the numbers were derived.
The Data
Statistical correlations require data ... This correlation
requires corresponding track times and speed ratings ... This data were
collected as follows:
(1) Track Times were taken from the on-line track
databases as they existed in early April 2007 (Boys
Track Database ... Girls Track Database) ...
In general, for every boy in the database, his best 3200m and 1600m times were
extracted from the past year or two ... A similar data extraction was done for
the girls 3000m and 1500m.
(2) Speed Ratings were taken from the existing
on-line cross country databases as they existed in
early April 2007 ... An "overall" speed rating was derived for every runner with
data for the 2006 XC season ... An "overall" speed rating is a composite of the
highest speed ratings (both recent and seasonal) and various averages (both
recent and seasonal) ... Overall speed ratings are used for the individual XC
rankings on this web-site (see NY State Boys
Rankings Page as an example).
Note ... The existing on-line databases (as of
April 2007) are limited to NY State runners (who have not graduated) ... So the
statistical correlation was done strictly with NY State runners.
Correlation Methodology
Four separate correlations were done:
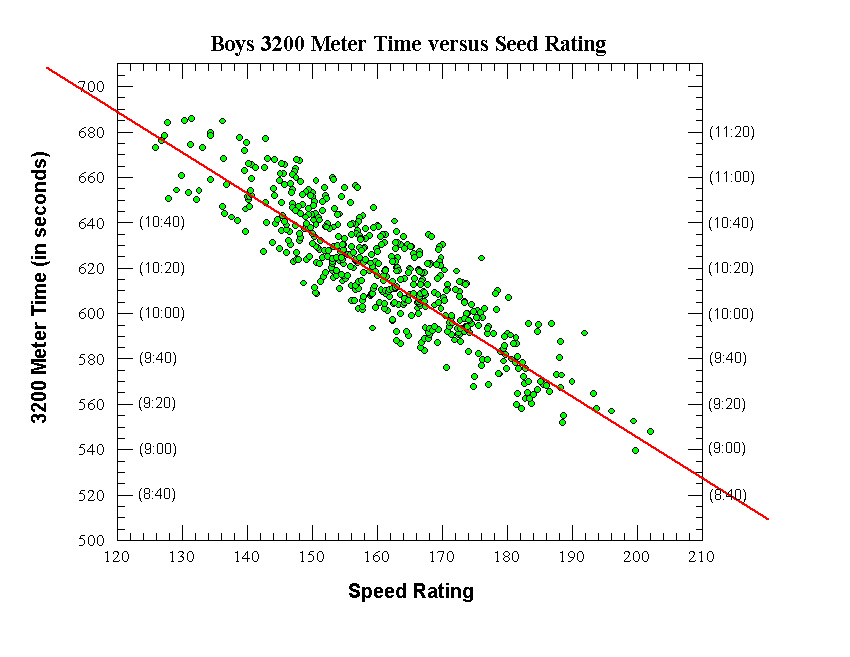
(1) Boys 3200m vs. Speed Rating
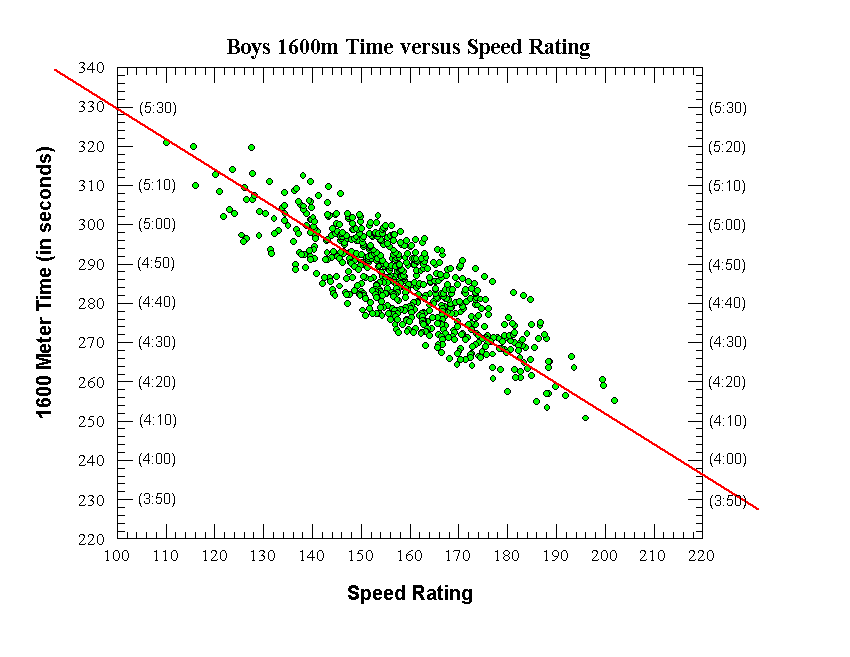
(2) Boys 1600m vs. Speed Rating
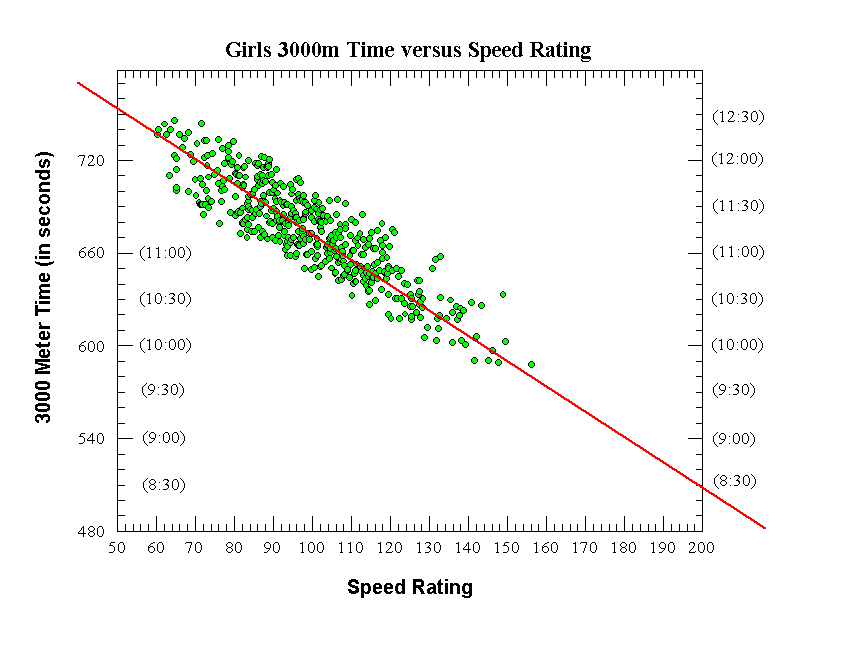
(3) Girls 3000m vs. Speed Rating
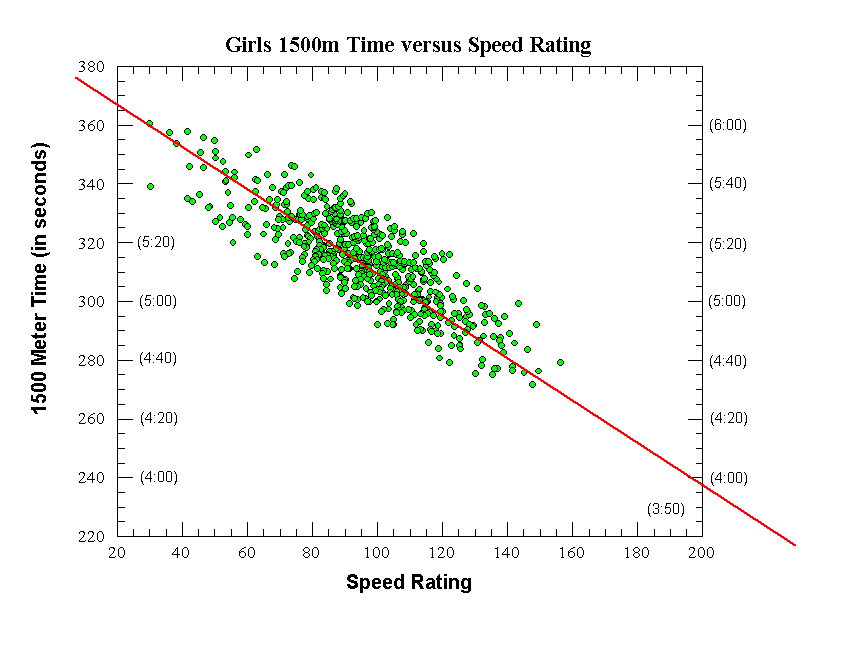
(4) Girls 1500m vs. Speed Rating
For the Boys 3200m vs. Speed Rating correlation, the list
of boys with 3200m race times was compared to the list of boys with a 2006 speed
rating ... Boys having both a 3200m time and a speed rating had their
corresponding 3200m times and speed ratings placed into a statistical
spreadsheet program (a total of 559 boys had both) ... The spreadsheet had two
columns ... (1) speed ratings and (2) the race time in seconds.
The two columns in the spreadsheet were used to
derive an equation via a simple linear regression ... A linear regression
finds the equation for a straight-line that is a statistical "best-fit" for the
data points on a graph (see the correlation graphs below).
The initial linear regression was used to identify outlier
data points and remove those data points from the regression ... for example,
any data point in the the Boys 3200m vs. Speed Rating correlation that deviated
by more than half-a-minute (from the straight-line) was thrown-out ... After
removing all outlier data points, the regression was redone.
A similar procedure was done for all four separate
correlations ... Graphs (with outliers removed) and statistics for the
correlations are shown below.
Problems
A simple linear regression depends upon data points that
are roughly equal in quality ... While many data points in these correlations
are roughly equal in quality, there are also a fair number that may not be
equal in quality ... And the quality of the resulting correlation depends
on the quality of the data ... Here are some possible problems:
(1) The track database has limited data for some runners
due to the availability of results ... Therefore, their "best" track times at
various distances may not be in the database ... if the difference between the
actual best time (not in the database) and the time in the database is small,
then the problem is minor ... but sometimes there may be large differences.
(2) Not all runners have representative track times at
various distances ... One reason is some runners do not run certain distances in
track or only run the distances infrequently or not "all-out" for time.
For example, Geoff King (FM) has a database best 3200m time of 9:51.3 which is
clearly not representative of runner with a best 1600m time of 4:16.35 or
a Steeplechase of 9:36.0.
Some runners don't get a chance to run a fast competitive
time at some distances because a team may have a bunch of good distance runners
and only a select few get the opportunity to run that distance ... so a
best-time in my track database may be skewed.
As another example, some runners never try to run a fast
track time at a specific distance ... Lopez Lomong (Tully) was a Footlocker
Finalist and NY State XC Federation champion (and a 4:10 1600m runner), but his
best outdoor 3200m in high school was 9:36 because Lopez never attempted to run
a fast 3200m (he only ran the distance to score points for the team in certain
meets) ... Dominic Luka (Tully), second at NY XC Feds, never ran a
sub-10:00 3200m in high school because he typically ran the 200m to 800m
distances in track.
(3) Difficult to quantify, but some runners are just
better at track than cross country or vice versa ... One reason is some
runners just prefer one season to the other ... Another reason is the
added distance in XC affects some runners more than others.
These problems (and others) can cause some inequalities in
the data points used to derive an equation ... removal of outlier data points
fixes some of the problem (but not all).
One Fix ... One method to minimize data inequality
is to "weight" some data points as better than others ... This can be
accomplished by going through the databases and selecting individual runners
with lots of good available data for both track and cross country ... Examples
are Hannah Davidson (Saratoga) and Tommy Gruenewald (FM) - data for these types
of runners can help position the location of the straight line at the upper
regions of the data (the top runners have much more data in the track database
than other runners).
Results - Accuracy of the Equations
The statistics and graphs of the equations are
shown below ... Even with the outlier data points removed,
the graphs shown a significant spread (range of data above and below a best-fit
straight-line).
For the Boys 3200m (after outlier removal) - the average
deviation is 10.58 seconds ... This means that on average, the 3200m time varies
by plus or minus 10.58 seconds from a specific speed rating ... That's quite a
bit - but not surprising due to the nature of the data ... The R-squared
correlation coefficient is 0.775 which basically means that the equation can
predict 77.5% of the variance from a perfect-fit (which isn't too bad for this
type of data).
Please remember this about the resulting equations
... They may appear to be exact, but they are only a "best-fit" for a data range
of values that will vary by a certain margin ... The equations are not
perfect - and could never be perfect because the data upon which they
are based are not perfect.
A Chart of Speed Ratings
vs. Track Times (application of the equations) is located on a
separate web-page.
Conclusion
I can say this ... the graphs and statistics
demonstrate there is a reasonable statistical correlation between track times
and speed ratings ... But it must be remembered there is a range of
variation (plus or minus a certain number of seconds) over which the equations
are applicable.
Side-Consideration ... The
Chart of Speed Ratings vs. Track Times
also shows the corresponding times for 3200m vs. 1600m vs. 3000m vs. 1500m ...
This correspondence was not done directly by this study; however, the
corresponding times have some merit for the following reason - many runners had
both a 3200m and 1600m time (or both a 3000m and a 1500m time) ... since the
same speed rating was used for both times, a cross-correlation exists which
directly relates one distance to the other for these runners.
Statistics and Graph Generation ... All
statistics and graphs were done using ProStat
v4.11 (Poly Software International) software on a Dell XPS 410 computer
(Windows Vista operating system with 2GB memory, E6700 dual-core processor).
Graphs and Statistical Results:
 |
Boys 3200 Meters

Final Equation (straight red line on graph):

   3200m Time (in sec)  =  -1.775 x Speed Rating + 900

Raw data:
  Number of data points (individual runners)  =  559
  Correlation coefficient (r)  =  0.812
  Correl. coeff. squared (r^2) =  0.659
  Standard deviation (seconds) =  16.47 seconds
  Average deviation (seconds)  =  12.73 seconds

After Initial removal of outlier data points:
  Number of data points (individual runners)  =  519
  Correlation coefficient (r)  =  0.8803
  Correl. coeff. squared (r^2) =  0.775
  Standard deviation (seconds) =  12.87 seconds
  Average deviation (seconds)  =  10.58 seconds
|
 |
Boys 1600 Meters

Final Equation (straight red line on graph):

   1600m Time (in sec)  =  -0.7625 x Speed Rating + 405.25

Raw data:
  Number of data points (individual runners)  =  695
  Correlation coefficient (r)  =  0.7576
  Correl. coeff. squared (r^2) =  0.574
  Standard deviation (seconds) =  8.32 seconds
  Average deviation (seconds)  =  6.64 seconds

After Initial removal of outlier data points:
  Number of data points (individual runners)  =  636
  Correlation coefficient (r)  =  0.8246
  Correl. coeff. squared (r^2) =  0.680
  Standard deviation (seconds) =  6.74 seconds
  Average deviation (seconds)  =  5.63 seconds
|
 |
Girls 3000 Meters

Final Equation (straight red line on graph):

   3000m Time (in sec)  =  -1.6267 x Speed Rating + 834.3

Raw data:
  Number of data points (individual runners)  =  560
  Correlation coefficient (r)  =  0.7828
  Correl. coeff. squared (r^2) =  0.613
  Standard deviation (seconds) =  22.5 seconds
  Average deviation (seconds)  =  17.5 seconds

After Initial removal of outlier data points:
  Number of data points (individual runners)  =  471
  Correlation coefficient (r)  =  0.8891
  Correl. coeff. squared (r^2) =  0.791
  Standard deviation (seconds) =  14.9 seconds
  Average deviation (seconds)  =  12.5 seconds
|
 |
Girls 1500 Meters

Final Equation (straight red line on graph):

   1500m Time (in sec)  =  -0.733 x Speed Rating  + 381.7

Raw data:
  Number of data points (individual runners)  =  672
  Correlation coefficient (r)  =  0.76
  Correl. coeff. squared (r^2) =  0.578
  Standard deviation (seconds) =  10.80 seconds
  Average deviation (seconds)  =   8.54 seconds

After Initial removal of outlier data points:
  Number of data points (individual runners)  =  625
  Correlation coefficient (r)  =  0.825
  Correl. coeff. squared (r^2) =  0.68
  Standard deviation (seconds) =  8.90 seconds
  Average deviation (seconds)  =  7.31 seconds
|